Putting Performance Into Perspective

..[while this article was written for investment professionals, we’re confident individual investors will also find this article very informative for managing their investments]…
The year 2019 was a great run for the S&P 500 Index. Its 12-month total return of 31.49% was more 3x higher than its 50-year average annualized return of 10.60%. All good, right?
Shown below are the annual returns of the S&P 500 Index over the past 50 years (1970-2019). Highlighted in purple are those years when the calendar-year return eclipsed 30% (shown by horizontal black line). It’s worth noting that since 1970 we don’t see two years in a row with a 30% or higher return. In fact, the average return in the year after a 30%+ return was 13.4%–including 2 years in which the following year’s return was negative (1981 and 1990).
S&P 500 Index: Past 50 Years
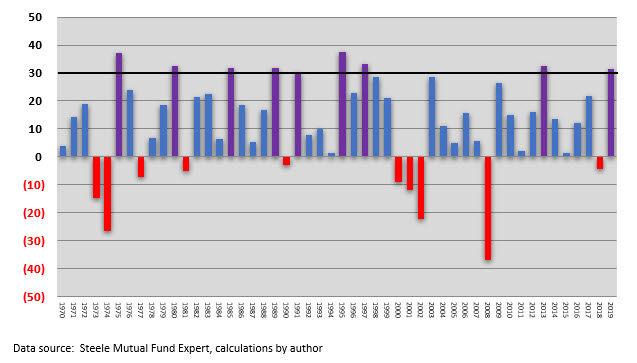
None of this predicts what the return for the S&P 500 will be in 2020. However, it should be clear that when any investment has a return well above its mean (or average) it is simply a matter of time before performance adjusts to more normal levels.
Performance adjusting to “normal levels” suggests smaller positive returns…as well as negative returns for an equity index such as the S&P 500. As we can see from the 50-year graph there have been 10 years over the past 50 that the S&P 500 Index produced a negative annual return (shown by red colored bars in the graph). The average return in those 10 years was -14.08%.
Negative returns are problematic. A loss of 14.08% requires a gain of 16.39% to break even. The ugly mathematical reality is that gains and losses are non-symmetrical. For instance, a loss of 20% requires a subsequent gain of 25% to break even. A loss of 35% requires a 54% to be made whole. A loss of 50% demands a 100% gain to recover fully. A loss of 75% requires a 300% gain to break even. You can see the asymmetry in these examples. The larger the loss the disproportionately larger gain is needed to break even.
When investing exclusively in equity (such as the S&P 500 Index) the road is naturally rocky. Even so, there are clearly more up years than down years (as shown over the past 50 years the S&P 500 Index produced positive annual returns 80% of the time). Nevertheless, the years in which there are losses produces a disproportionate amount of damage because of their asymmetrical relationship with gains.
Is there a smoother performance path to be had? Of course. Building a portfolio that broadens the diversification across multiple asset classes creates a pattern of performance that can minimize the magnitude and frequency of damaging negative returns.
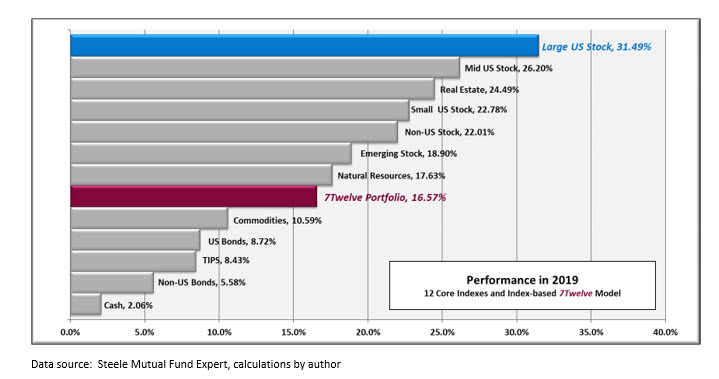
In “2019 Performance” you will see the performance of 12 key indexes (equity and fixed income) as well as the overall performance of the 12-indexes combined into a portfolio. The indexes are the following: S&P 500 Index, S&P Midcap 400 Index, S&P Small cap 600 Index, MSCI EAFE Index NR, MSCI EM Index GR, S&P Global REIT Index, S&P North American Natural Resources Index, DBLQ Optimum Yield Diversified Commodity Index Excess Return, Barclays US Aggregate Bond Index, Barclays US Treasury US TIPS Index, Barclays Global Treasury Index, and the 90-day US Treasury Bill.
Not surprisingly, the best performing index in 2019 among these 12 was the S&P 500 Index. The lowest return was achieved by 90-T-Bills (or “cash”) at 2.06%. The equal-weighted combination of all 12 indexes (using the philosophy of the 7Twelve® Portfolio) produced a return in 2019 of 16.57%–well below the return of the S&P 500 Index.
Not too surprising really. The S&P 500 is a 100% U.S. equity index. The combination of the 12 indexes creates an investment model that is approximately 66% equity and diversifiers (such as real estate, natural resources, and commodities) and 34% fixed income.
2019 Performance
Twelve Key Indexes and a 12-Index Portfolio
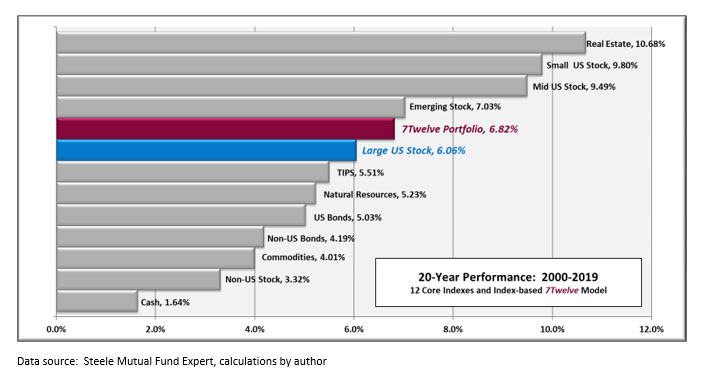
How has a broadly diversified portfolio of 12 indexes performed over the past 20 years? A longer time horizon is a better measure of the real character of an investment philosophy.
As shown in “20-Year Performance” the best performing index over the past two decades (2000-2019) was real estate (specifically the S&P Global REIT Index). This REIT index produced an average annualized return of 10.68%, or 462 basis points higher than the S&P 500 Index return of 6.06%. Interestingly, a broadly diversified 12-index portfolio (equally weighting and annually rebalanced) also outperformed the one-dimensional S&P 500 Index by 76 basis points.
Not shown in the graph, but worthy of note, is that the 12-index portfolio bested the performance of the S&P 500 Index and did so 32% less volatility (as measured by the standard deviation of annual returns).
20-Year Performance
Twelve Key Indexes and Multi-Index Portfolio
There are two key observations in this analysis that your clients may benefit from.
First, the S&P 500 Index is seldom the correct performance benchmark for most portfolios. If you’ve built a broadly diversified portfolio for your clients, it would be most appropriate to use a broadly diversified index, such as the 7Twelve model, as their performance benchmark. The performance of the 7Twelve model (using S&P Indexes) is now calculated on a daily basis by S&P Dow Jones custom indices under the name of the “Lunt Capital 7Twelve Moderate Index”. The link below will take you to the S&P Dow Jones Custom Indices website:
http://www.customindices.spindices.com/indices/custom-indices/lunt-capital-7twelve-moderate-index
Second, being invested in a broadly diversified portfolio is relatively boring. Years with performance of 30% or better will seldom, if ever, occur. It’s a steadier approach without the dramatic ups…and downs. Understandably, some clients just are not good candidates for such an approach because it lacks the sizzle they apparently need. But, for many clients, it just may be the right recipe. At least, the math of gains and losses will be on their side.
Craig L. Israelsen Financial Planning Magazine March 2020
http://www.7twelveportfolio.com
7Twelve is a multi-asset balanced portfolio developed by Craig L. Israelsen, Ph.D. in 2008. Unlike a traditional two-asset 60/40 balanced fund, the 7Twelve balanced strategy utilizes multiple asset classes to enhance performance and reduce risk.