When Boring is Good
Craig L. Israelsen

It’s that time again…for a performance review of key market indexes. In addition, we’ll examine the performance of a broadly diversified 12-index portfolio model. The indexes in this analysis represent the following broad asset classes: US equities, non-US equities, real estate, resources/commodities, US bonds, non-US bonds, and cash.
Shown below in “20-Year Performance” are the annual returns of 12 key indexes and a 12-index equally-weighted portfolio model over the past 20 years (all performance data as of 12/31/2018). Also shown is the 20-year annualized return (which is a geometric mean), the 20-year standard deviation of annual returns, and the 20-year growth of a $10,000 lump sum investment. Negative annual returns are shown in red.
The S&P 500 Index started out this particular 20-year period with a healthy gain of +21.04% in 1999. But, in 2000 it had a return of -9.10%. In 2001 the pain continued with a return of -11.89%, and then 2002 the S&P 500 Index declined by -22.1%. Patient investors that persisted through the pain were rewarded with positive returns from 2003 to 2007 (28.68%, 10.88%, 4.91%, 15.79%, and 5.49%). Then, of course, the world collapsed in 2008. The S&P 500 Index fell 37.00% that year. Once again, patient investors that hung in there were rewarded with nine consecutive years of positive returns (2009-2017). For most of 2018 it appeared that the winning streak would continue. Half way through the year (June 30, 2018) the S&P 500 was up +0.61%. By the end of November, the year-to-date return was +7.48%. Then December happened. The S&P 500 Index lost 8.84% to finish 2018 with an annual return of -2.02%–its first annual loss since 2008.
Also included in the table are the returns for the S&P Midcap 400 Index, the S&P 600 Small Cap Index, MSCI EAFE Index, MSCI Emerging Markets (EM) Index, S&P Global REIT Index, S&P North American Natural Resources Sector Index, Deutsche Bank Liquid Commodity Index, Barclays U.S. Aggregate Bond Index, Barclays U.S. TIPS Index, Barclays Global Treasury ex US Index, and 3 month US Treasury Bills (which represents the return of “cash”).
The index with the highest return each year is highlighted in yellow. It’s interesting to note that the S&P 500 was the highest performer (among these 12 indexes) only once during the past 20 years (in 2015)—in spite of the fact that it is probably the most observed and mimicked index in the world. Real estate and emerging markets have been the best annual performer 5 times each. Commodities had the best annual return twice (2002 and 2004). Cash, the Rodney Dangerfield of asset classes, was the best performer once—in 2018!
When asset classes get beat up (and they all do), it’s tempting to forget the long-term picture and the achievements of the past and react only to the current pain. That approach generally ends badly for investors and in most every walk of life as well. Successful investing isn’t necessarily about good timing (though that’s nice when it happens)—it’s more about consistently good behavior. Success is likely when building a broadly diversified strategy and staying with it. Moreover, it’s important to rebalance the portfolio because when you do you are actually “selling high and buying low”. An example of a diversified strategy is illustrated in the far- right column of the table: a 12-Index Portfolio Model. It is a portfolio strategy that combines all 12 indexes—equally weighted at 8.33% each and annually rebalanced. In practice, you would build such a model using ETFs and/or mutual funds to represent each asset class.
Several attributes of the 12-index portfolio model quickly stand out. First, it never once had the highest annual return. Guess what? It never will. It’s impossible. A diversified portfolio that contains multiple distinct asset classes will never out-perform the best performing single asset class within the portfolio. And, conversely, it will never perform as badly as the worst performing ingredient in it. Those are the basic ground rules of a diversified portfolio—it delivers middle-of-the-road, steady returns. Will that be good enough? Some may feel that such an approach is simply too boring. Let’s let the numbers to the talking.
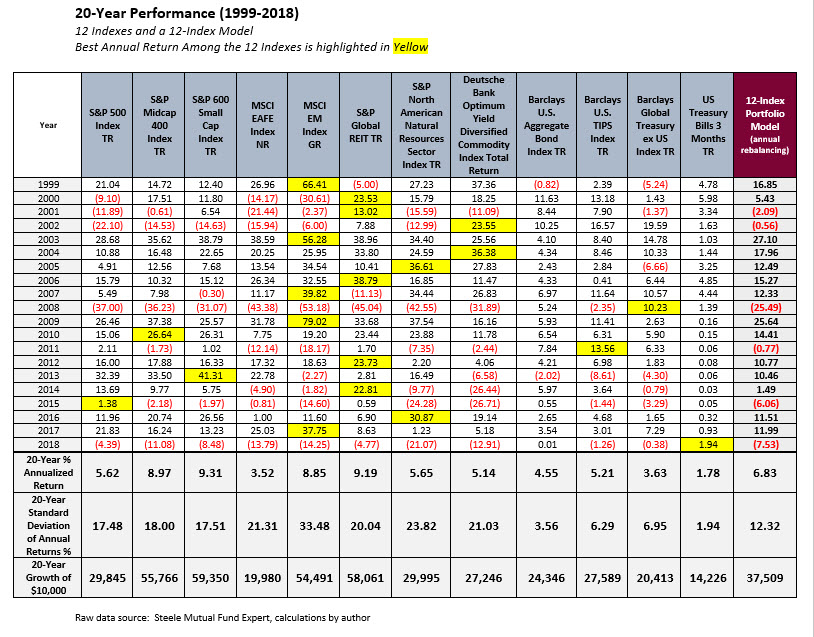
Over the past 20 years a 12-index portfolio that was annually rebalanced delivered an annualized return of 6.83%–which exceeded the 20-year performance of eight of the individual indexes, including the S&P 500 Index, the MSCI EAFE Index, the S&P American Natural Resources Index, the Deutsche Bank Commodity Index, the Barclays Aggregate Bond Index, the Barclays TIPS Index, the Barclays Global Treasury Ex-US Index, and US 90-day Treasury Bills. Is that good enough?
Plus, the 12-index model (i.e., multi-asset portfolio) delivered a 6.83% annualized return while producing a 12.3% standard deviation of annual returns. By comparison, the S&P 500 had a 17.5% standard deviation. Thus, the 12-index portfolio had higher return by 121 basis points compared to the S&P 500 Index over the past 20 years–and with roughly 30% less volatility. Maybe boring is good.
Midcap US stock, small cap US stock and global real estate have clearly been the standout performers among these 12 indexes based on their 20-year annualized returns of right around 9% (+/-). In producing that level of return each index had a standard deviation of between 17.5% to 20%–which is basically the same level of volatility as the S&P 500 Index, but roughly 50% higher than the 12-index model. Is the extra volatility worth it? That is the challenging question that every advisor undoubtedly contemplates frequently. In terms of volatility, the performance of emerging markets pegs the risk meter with a 20-year standard deviation of annual returns of 33.5%. Emerging markets did, however, deliver an impressive 20-year annualized return of 8.85%. Once again, is that level of volatility worth it? Losses can be huge, such as the -53.18% return in 2008.
A helpful way to visualize the combination of risk and return is shown in “Risk/Return Tradeoff”. The lower right quadrant of the graph represents low return and high volatility. Over the most recent 20 years, commodities, natural resources, and non-US stock are positioned there (albeit not too deeply in the southeast quadrant). The lower left quadrant represents lower return with lower volatility—which is the normal location for fixed income indexes. Also located there—albeit barely—is the S&P 500 Index.
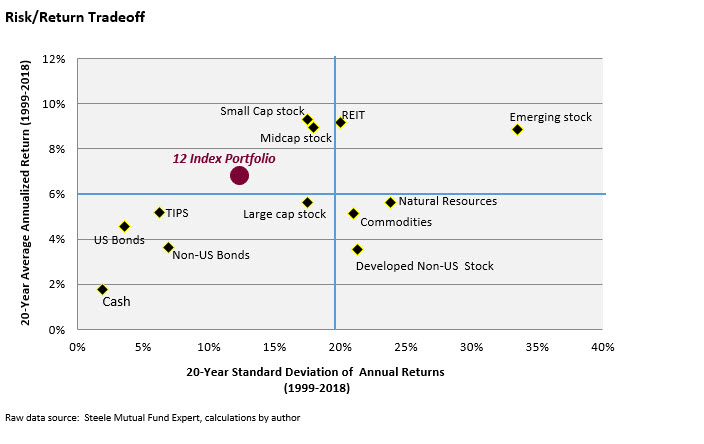
The upper right quadrant of the graph represents high return and high volatility. The only index that is genuinely in that quadrant is emerging markets. Real estate, though it barely crosses the border, will be categorized in the upper left (or northwest quadrant). Also located in the coveted northwest quadrant (representing higher return with lower risk) is small cap and midcap US stock…and the 12-index model.
Five key observations:
(1) This analysis is over a 20-year period, not a 3-year or 5-year period. The benefits of diversification manifest themselves over longer time frames where the ebb and flow of market cycles are combined with the benefits of systematic portfolio rebalancing.
(2) Clients who check their portfolios every 15 minutes—or every 15 days—may not be good candidates for a diversified model. Clients that micro-manage their investments will not likely have the patience to endure the “moderate-growth” performance behavior of a broadly diversified portfolio. A possible solution for the client who tends to be a diehard micro-manager: partition their portfolio into two segments. One segment is a broadly diversified model, where no micro-management is allowed. Checking it annually and rebalancing are the ground rules. The other segment is comprised of stocks or funds that the client is allowed (but not encouraged) to micro manage–within reasonable guidelines.
(3) The 12-index model was NEVER the winner in any given year. It never will be. The investor who diversifies needs to be content with hitting singles and doubles—very seldom will they hit home runs. Diversified investing is a long- term philosophy, not a short-run tactic. When a diversified portfolio is built, encourage the client to plant an oak tree at the same time. I think they’ll understand the point of that suggestion.
(4) This 12-index model that does not favor any index, but rather employs equal-weighting among the 12. As such, it is a purely strategic approach and is not attempting to market-time any particular asset class by overweighting it. However, viewed at the macro level, eight of the twelve indexes fall into the equity or diversifier asset class and four of the indexes are fixed income, thus it represents a 65% growth/35% fixed income overall asset allocation. This 65/35 allocation puts the 12-index model in the camp of “balanced funds” with their classic 60% stock/40% bond allocation. Vanguard Balanced Index (VBIAX) is a worthy representative of the 60/40 balanced model. Over this same 20-year period, Vanguard Balanced Index had an annualized return of 5.67% and a standard deviation of 10.5%. Compared to the 12-index model, Vanguard Balanced had lower return and slightly lower volatility.
(5) Building a diversified portfolio such as the one illustrated here need not be expensive. Using a variety of ETFs (exchanged traded funds) to represent these 12 indexes can result in an actionable portfolio with a total annual expense ratio of less than 20 bps. The verdict: Over the 20-year period from 1999-2018 a diversified 12-index model fared well…for the patient investor. But, in the end, patient investors generally do better anyway.
Financial Planning Magazine, March 2019