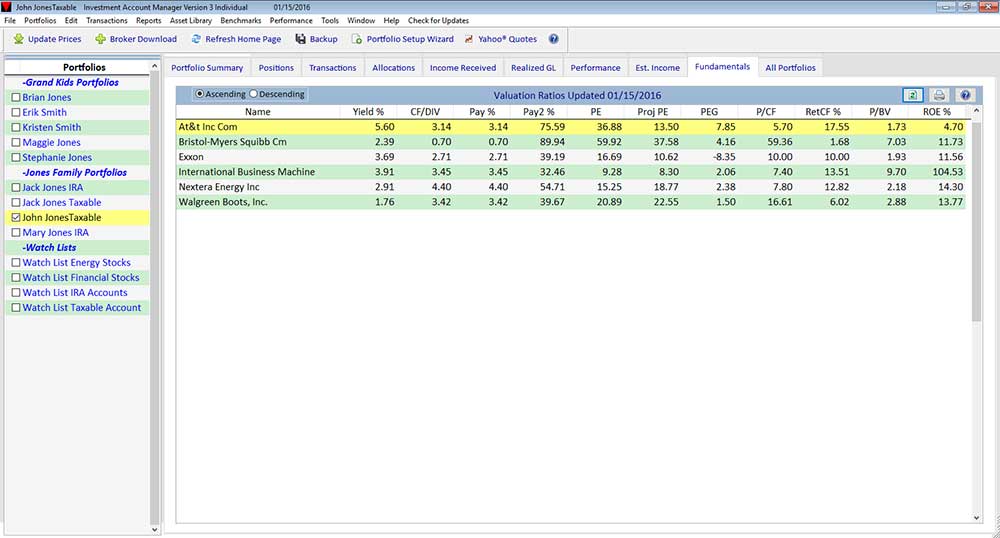
The valuation ratios displayed include:
- Current Yield %: if you are an investor seeking income as well as growth, current yield will indicate if the company is paying a dividend, and if the rate of payment is sufficient to meet your requirements. Current yield is calculated by the current dividend per share divided by current market price.
- Cash Flow/Current Dividend: The cash flow/current dividend relationship is important because at times, for any number of reasons, a company may not be "earning" their yearly dividend. Investors worried about the sustainability of the dividend should be concerned if the cash flow per share covers the dividend.
- Dividend Payout Ratio %: this ratio shows what percentage a company is paying out its earnings (current dividends per share divided by current earnings per share).
- Dividend Payout Ratio % 2: this ratio shows an estimate of the forward-looking company payout (current dividends per share divided by projected earnings per share).
- Price/Earnings (P/E): perhaps the most frequently used ratio to judge the degree of valuation for a security, P/E is simply current market price divided current earnings per share.
- Projected P/E: Projected P/E is simply current market price divided by projected earnings per share. Look for the projected P/E ratio to be less than the current P/E ratio.
- PEG Ratio: one of the "Famous Numbers" from Peter Lynch's book One Up On Wall Street, this relationship compares earnings growth with the price/earnings ratio, the principle being that the market values a stock so that it sells at a price that reflects its earnings potential. The PEG ratio is derived by the Current P/E Ratio Projected Earnings Growth %.
- Market Price/Cash Flow per Share & Return on Cash Flow %: Market price/cash flow per share gives an indication of what ratio a stock is trading at in relation to the cash flow being generated from operations after all cash expenses have been subtracted. To better understand this ratio, the inverse of the ratio can be used to derive the return on cash flow.
- Market Price/Book Value per Share: the market price/book value ratio gives an idea of how a security is trading in relation to its book value.
- Return On Equity: this value shows how much is being earned each year by the company, where the higher the percent returned, the better for the investor.
Return on equity is computed by dividing earnings per share by book value per share. As a growth investor, you want to see steady or rising return on equity.